Introduction
Most businesses treat the monthly summary report from their answering service as a formality — something to skim before filing. The call count looks reasonable, nothing seems broken, so the report gets closed. That's a missed opportunity.
Every call your answering service handles generates data that belongs to your business: when customers called, why they called, how long they waited, whether they got a resolution. That data is sitting in a dashboard most operators check only after something goes wrong.
According to CallRail's 2025 survey of 1,000 U.S. consumers, 78% of respondents had abandoned a business after an unanswered call. Having an answering service covers the call. Using what it tells you is what keeps the customer.
This guide explains how businesses turn answering service analytics into real operational decisions: staffing adjustments, smarter routing, service quality improvements, and sharper marketing spend. Businesses interested in seeing how Eva Speaks generates structured call analytics can Request Live Demo.
Key Takeaways
- Call analytics goes beyond volume — tracking intent patterns, missed call trends, handle time, sentiment, and resolution outcomes
- Review operational metrics (volume, missed calls) weekly; review trend data (call reasons, sentiment) monthly
- The highest-value uses are identifying why customers call, spotting service gaps, and updating routing or scripts in response to patterns
- AI-powered services like Eva Speaks produce structured call data — transcriptions, intent tags, and LLM-driven categorization — that basic logs can't match
- Small businesses gain as much from call analytics as large ones, without needing a dedicated QA team
What Analytics Data Does an Answering Service Provide?
The data your answering service generates depends heavily on the type of service you're using.
Basic live-operator services typically provide:
- Call logs with timestamps
- Call duration per interaction
- Missed or abandoned call counts
- Basic message delivery records
AI-powered services generate a fundamentally different dataset. AWS's post-call analytics documentation illustrates the gap: AI systems can produce full transcripts, talk time, interruptions, talk speed, generative summaries, per-turn sentiment scores, and issue/outcome classification — all automatically, on every call.
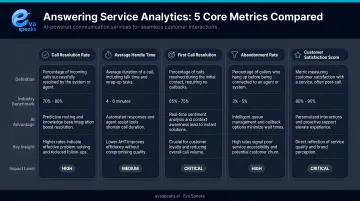
Core Metrics to Expect
Regardless of service type, these are the categories every business should be receiving:
| Metric | What It Tells You |
|---|---|
| Call volume by time/day | When customers are calling, and whether coverage matches demand |
| Missed/abandoned call rate | Whether callers are reaching someone before hanging up |
| Average handle time (AHT) | How long interactions take; outliers signal complexity or scripting gaps |
| Call reason/intent categories | Why customers are calling — the most actionable metric |
| Escalation or transfer rate | How often the service can't resolve a call on first contact |
Sentiment and Tone Signals
AI-powered services can flag calls where a caller expressed frustration or urgency. According to AWS's documentation, sentiment values can be tracked per conversation turn, producing both quantitative scores and qualitative labels (positive, neutral, mixed, negative). For customer experience management, this matters more than raw volume — a day with 40 calls and 30% negative sentiment is more concerning than a day with 80 calls and flat sentiment.
Transcription and Call Recording Access
Sentiment flags tell you a call went poorly — transcripts tell you exactly why. Full call transcripts let you audit whether key information (pricing, hours, appointment details) is being delivered consistently. They also surface recurring questions that your website, voicemail greeting, or intake script isn't answering.
EvaSpeaks' AI-enabled platform captures call and message metadata including audio recordings, transcriptions, and routing outcomes. Its LLM integration processes what was said and classifies intent — giving each call a structured record that basic operator services don't generate. This structured data output is one of the reasons the industry trend toward AI-powered answering services is accelerating: businesses are realizing that AI call handling generates richer operational data than human-only services, while often doing so at lower cost per interaction. You can Watch AI Call Flow Demo to see the kind of structured call data Eva Speaks generates from a single inbound call.
Here is how AI-native, traditional, and analytics-only answering service approaches compare for businesses tracking call performance:
| AI Answering + Analytics (EvaSpeaks) | Traditional Answering + Reporting | Analytics Software Only | |
|---|---|---|---|
| Features | AI calls + real-time transcription, intent tagging, CRM sync | Human agents + call logs, basic reports | Dashboard over existing call data |
| Best-fit Business Size | SMB to mid-market | Any size | Data teams, larger operations |
| Key Strengths | Unified call + data, zero manual tagging | Human agents for complex calls | Deep historical analytics |
| Implementation Complexity | Low | Low | Medium |
| Integration Capability | CRM, BI tools, ticketing native | Limited or manual | API-based |
How to Use Call Analytics from Your Answering Service
Getting value from answering service analytics means building a consistent review habit — one that connects specific metrics to specific decisions and responds to patterns, not just individual calls.
Setting Up Your Analytics Review Process
Before calls start, define:
- Which metrics you want tracked and how calls are categorized
- Who in your organization receives reports and acts on them
- How call categories map to actual business needs
The most common setup error: categorizing too broadly. A medical practice that logs everything as "general inquiry" loses the ability to see whether call volume spikes are driven by appointment requests, billing questions, or urgent clinical matters. Those three categories require completely different responses.
EvaSpeaks supports customizable call-flow scripts and routing rules, so category definitions can be built directly into the call-handling logic from day one rather than retrofitted later. This configuration flexibility means businesses can align EvaSpeaks' call categories with the exact buckets they track in their CRM or helpdesk — enabling cleaner data analysis without post-call manual tagging.
Interpreting Your Call Data
Call volume data only makes sense in context. Two patterns illustrate this well:
- Monday morning spikes often trace back to weekend ad spend or social media activity
- Post-hire resolution drops point to a training gap, not a service failure
Neither pattern is visible if you're reviewing call counts alone.
Missed call and abandonment rate deserves particular attention as an early warning signal. According to CallCentreHelper, a 2% abandonment rate is generally considered good, while anything above 5% indicates a staffing or routing problem. That's a concrete threshold — if your service is consistently above it, the data is telling you something operational needs to change.
Consistency matters as much as averages. ATSI's research notes that average speed-to-answer can mask highly inconsistent caller experiences — a useful reminder that summary metrics sometimes hide the individual call failures that drive customers away.
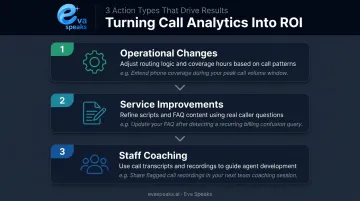
Acting on Insights
Three types of action consistently produce the clearest ROI from call analytics:
Operational changes — Adjust routing rules or hours-of-coverage when analytics reveal peak call windows that aren't being covered. If 30% of your calls come in after 6 PM and those callers are hitting voicemail, that's a routing problem with a direct fix.
Service improvements — Update scripts or FAQ responses when recurring questions reveal a communication gap. If callers repeatedly ask about something your website explains, the website isn't clear enough — or the right information isn't where people look.
Staff coaching — Use call transcripts to identify where human agents or escalation paths are underperforming. Call recordings give you specific examples, not just scores.
When analytics reveal a high volume of after-hours calls about a specific service, Eva Speaks' configurable call-flow logic gives businesses a direct path forward: handle those inquiries automatically instead of routing them to voicemail and losing the lead. You can See How AI Handles After-Hours Calls to understand exactly what that automated handling looks like in practice.
Monitoring Over Time
The first 30-90 days of data collection establishes your baseline — what "normal" looks like for your business. Once you have a baseline, deviations become actionable signals:
- Sentiment scores dropping over two weeks
- Abandonment rate rising without a corresponding volume spike
- A new call reason appearing frequently that didn't exist last month
One diagnostic sign that analytics aren't being used: months of identical data with no changes made to routing, scripts, or staffing. Collecting data without acting on it serves no operational purpose.
Where Businesses Apply Answering Service Analytics
Healthcare and Professional Services
Medical practices use call analytics to track appointment request patterns and ensure that HIPAA-sensitive interactions are handled consistently. MGMA's 2026 poll of medical practice leaders found that insurance eligibility and prior authorization account for 45% of time-consuming phone tasks, with appointment scheduling at 31%. Analytics help practices understand whether their answering service is handling that load or deflecting it — and where the bottlenecks are.
For law firms, the stakes are equally clear. Clio's 2024 Legal Trends Report secret-shopper study found that only 40% of law firms answered phone calls, with 48% essentially unreachable. Call analytics tell firms when calls are missed, how often, and what callers were trying to accomplish.
Home Services and Trades
Contractors and HVAC companies use call analytics to connect inbound call volume to marketing spend — identifying which campaigns generate calls versus which generate booked jobs. The data also surfaces the times of week when missed calls are highest, enabling coverage adjustments before those missed calls become lost revenue.
Answering Service Care's 2024 research identified contractors as one of the primary industries relying on answering services. During seasonal demand spikes, call analytics pinpoint exactly when volume surges and which call types drive it — giving operations teams the lead time to staff up rather than catch up.
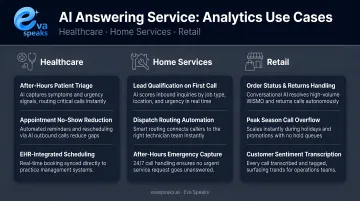
Retail and E-Commerce
Order inquiry and complaint call patterns often surface product or fulfillment issues before those problems appear in reviews or refund requests. A sudden spike in calls about a specific product's shipping status shows up in call reason data days before the negative review wave arrives — early enough to act on it.
Common retail use cases for call analytics include:
- Identifying fulfillment issues by tracking complaint call spikes per SKU or order batch
- Flagging seasonal support gaps before they generate refund requests
- Measuring how often order status calls could be deflected with proactive shipping updates
Best Practices for Consistent Value from Answering Service Analytics
Establish a review rhythm:
- Weekly: call volume, missed call rate, handle time
- Monthly: call reason trends, sentiment patterns, escalation rates
- Immediately: any time a business change occurs (new campaign, staff transition, pricing update)
No single metric tells the full story. High call volume isn't inherently good or bad without knowing why customers are calling. A low abandonment rate means nothing if callers are reaching someone but not getting resolution. Metrics only become meaningful in combination.
Distribute data across the teams that can use it:
- Marketing should see call reason trends — are customers calling about a promotion, or calling because the website is confusing?
- Product and service teams should see recurring complaint themes from transcripts
- Operations should see coverage gaps; sales should see conversion patterns
When call analytics stay siloed with whoever manages the answering service contract, most of their value never reaches the people who can act on it. Businesses that want to discuss how to distribute and act on call analytics can Talk to an AI Communication Expert.
Frequently Asked Questions
How would you use analytics for customer service?
Businesses use call analytics to identify recurring customer pain points, track resolution rates, and catch service failures early. A spike in calls about the same issue signals a gap that can be fixed before it surfaces in reviews.
What are the 4 types of business analytics?
Harvard Business School Online defines four types: descriptive (what happened), diagnostic (why it happened), predictive (what will happen), and prescriptive (what should be done). Answering service call data feeds into all four, from basic call logs to pattern-based routing decisions.
What metrics should I expect my answering service to report on?
At minimum: call volume by time period, missed/abandoned call rate, average handle time, and call reason categories. AI-powered services additionally provide sentiment scores, full transcripts, and intent classification.
How is answering service analytics different from internal call center analytics?
Answering service analytics reflect your outsourced or AI-handled front line — they show what customers encounter before reaching internal staff. They're especially useful for understanding first-contact experience and after-hours coverage gaps.
How often should I review call analytics from my answering service?
Weekly for volume and missed call data in time-sensitive businesses; monthly for trend analysis. Review immediately whenever a business change — new campaign, service update, staff transition — might shift call patterns.
Can small businesses benefit from answering service call analytics?
Small businesses often benefit most. Even reviewing 20-30 calls per week through transcripts or summary reports gives a solo operator visibility they'd never have otherwise, without the overhead of a dedicated QA team.